Take a look at our graphs all about changing matter!
Particles Depending on the State of Matter
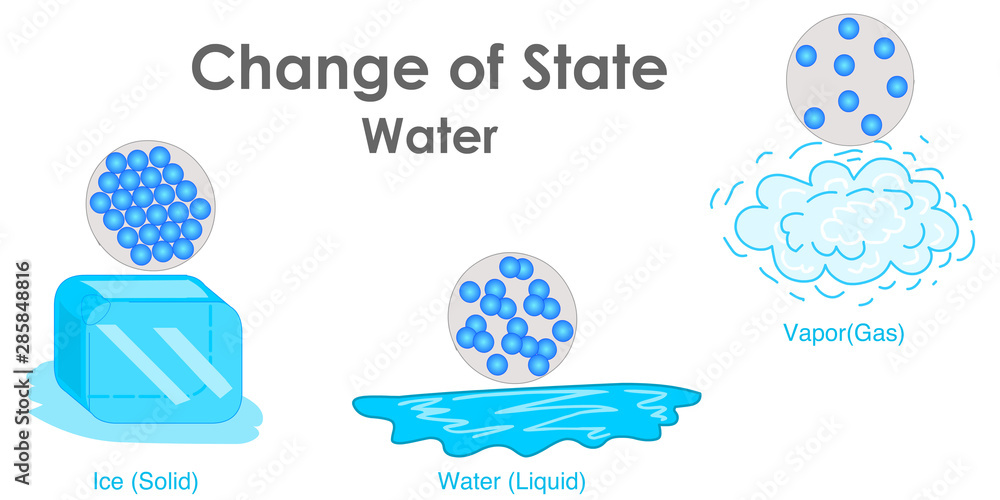
Every state of matter's particles have a different distance between eachother. Solid is the most close and packed, while on this graph, gas has the most seperated particles
The Changes Between the States of Matter (Custom Diagram)
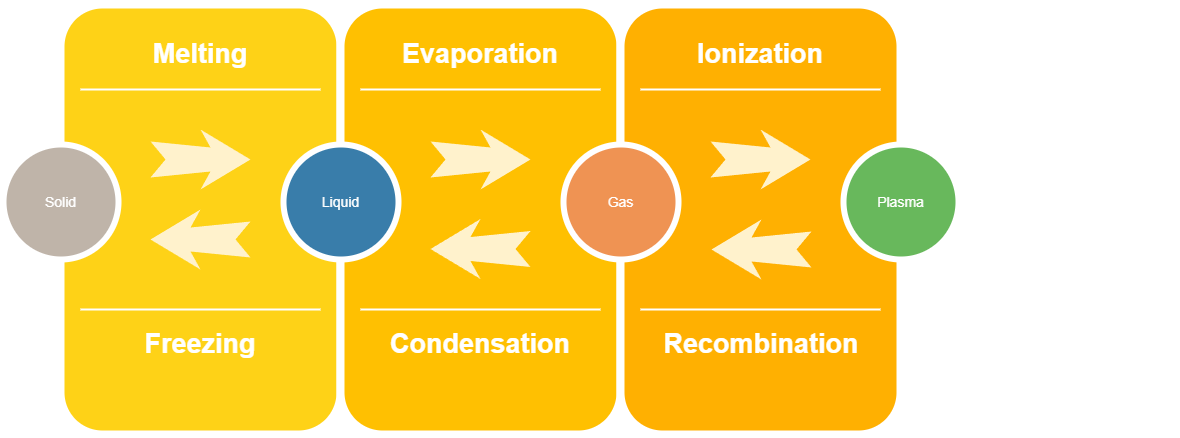
This diagram shwos the names of the changes between the states. Ex. to go from plasma to gas is Recombination
The Phase Diagram
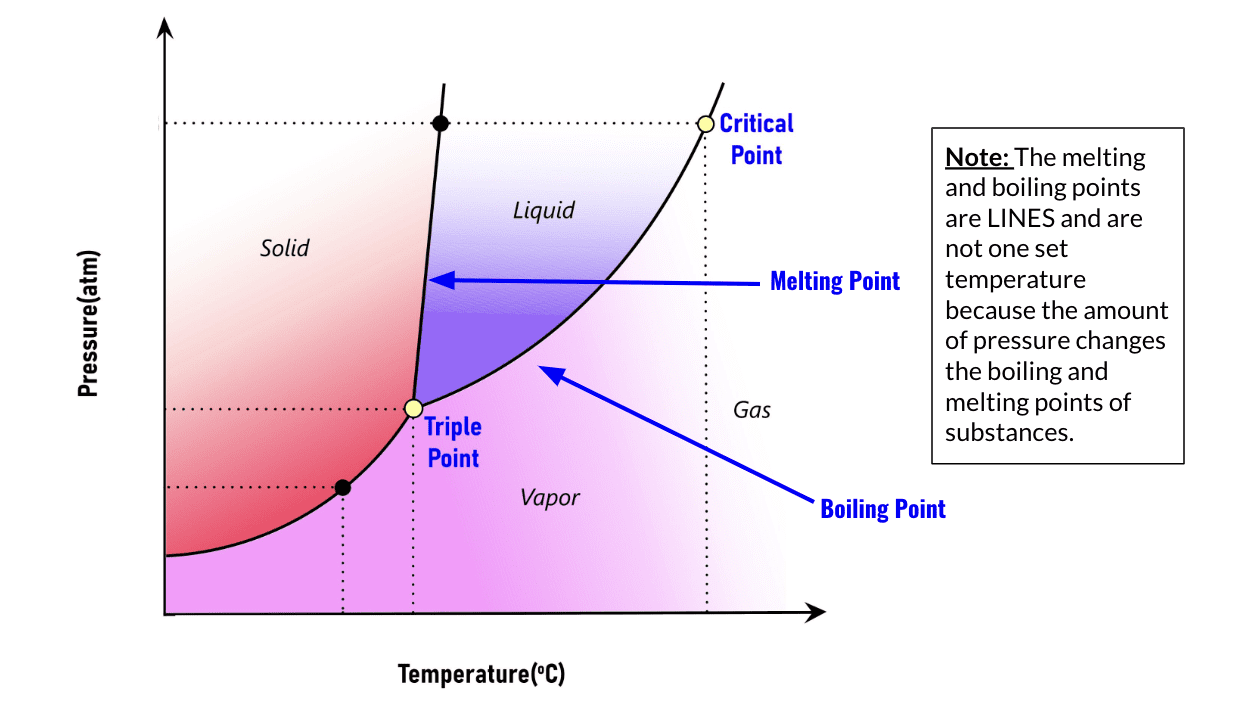
The phase diagram shows how you can change the state of matter by manipulating temperature and pressure. This phase diagram does not show any specific substance
Changes of the Elements With Temperature
This graph shows how some states of matter have less heat and/or temperature while others have much more. Along with that, it also shwos the effects of changing between the main 3 elements as temperature changes
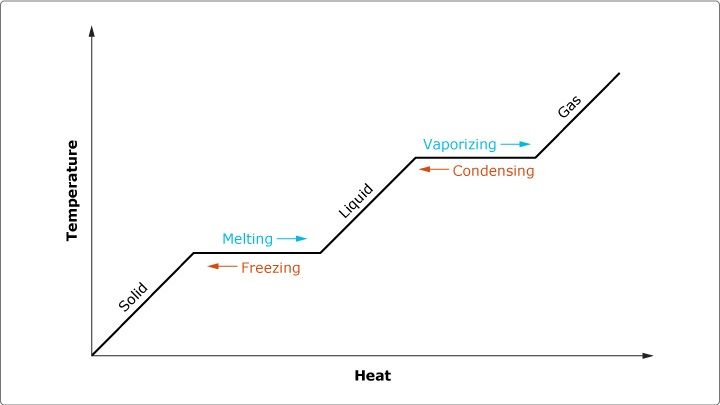
How Energy affects the elements
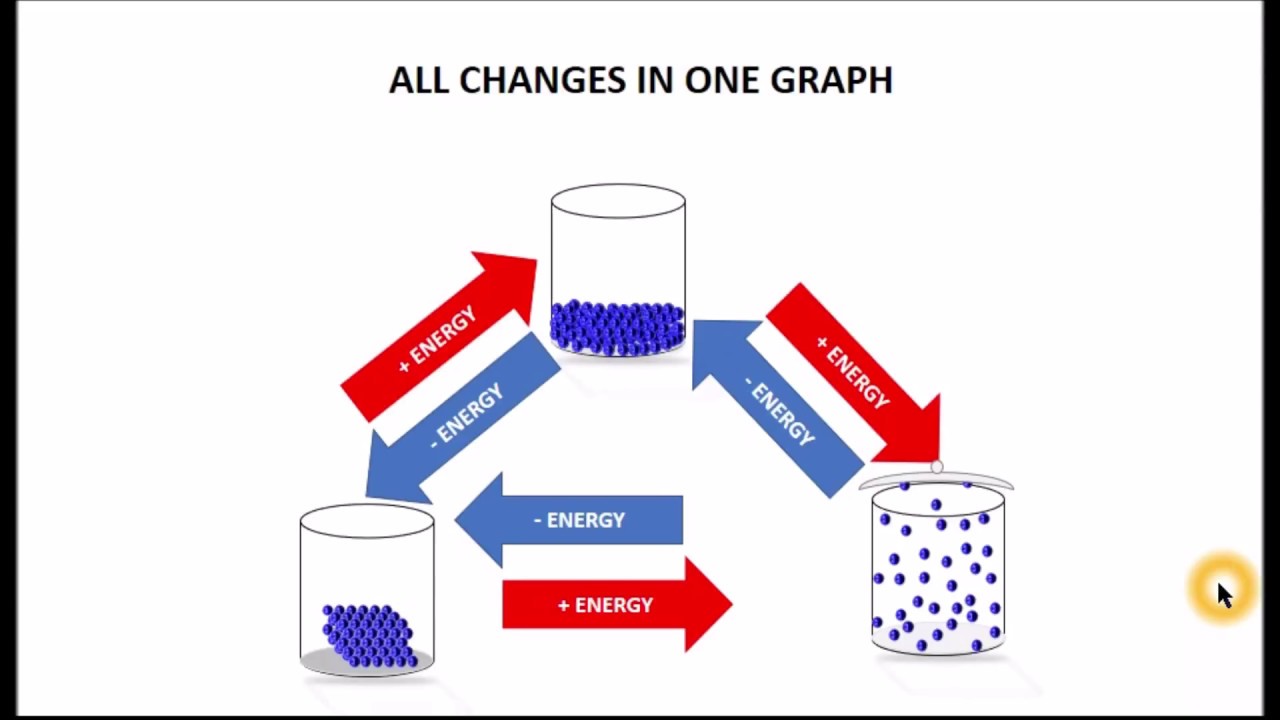
This graph shows how with the simple addition or removal of energy from a substance, you can change its state of matter
The Phase Diagram of Water Explained
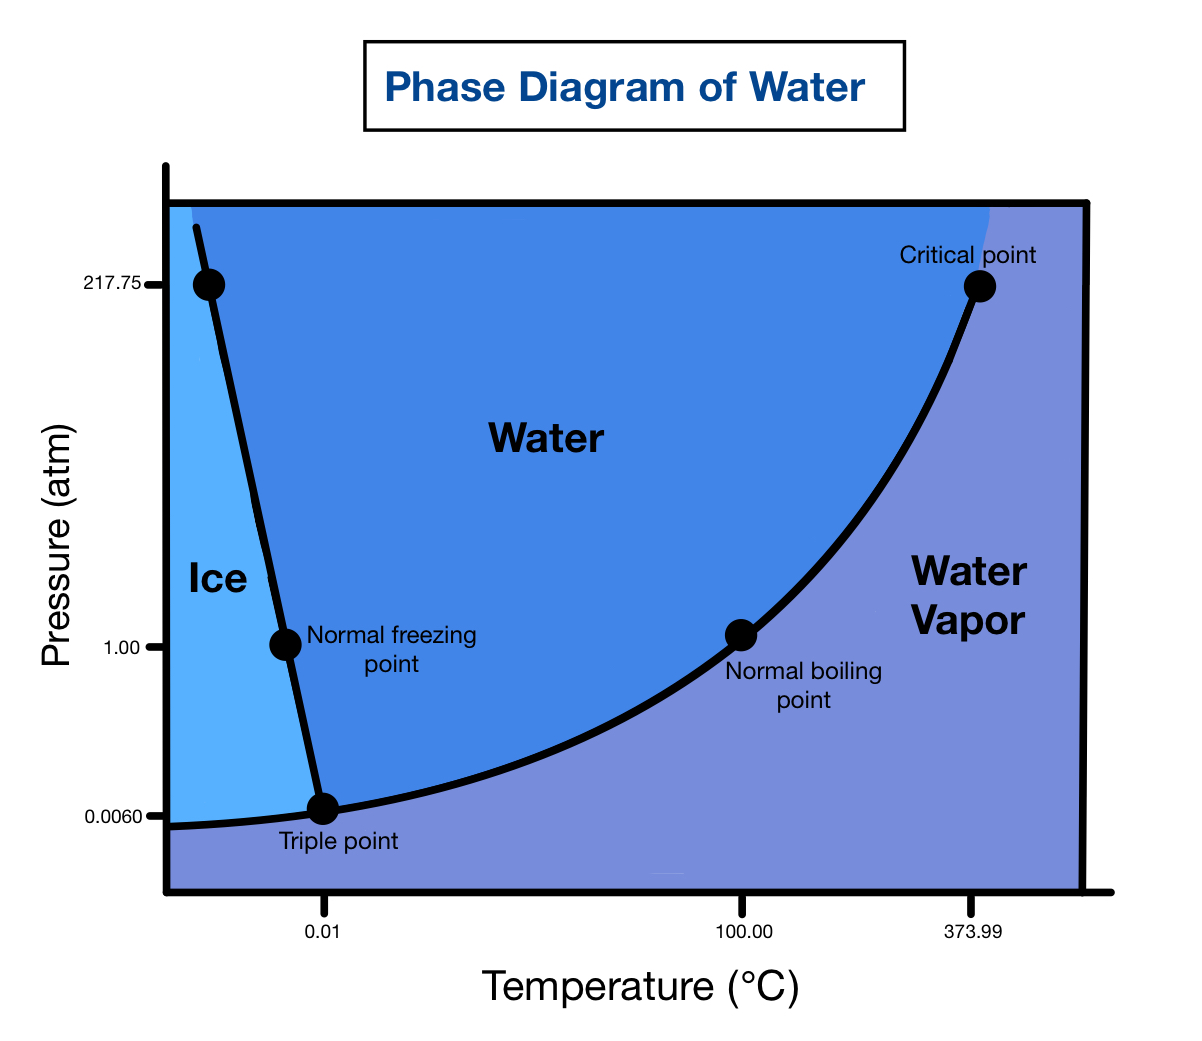
This phase diagram is built for water, which is why its layout is different from the basic Phase Diagram on this page